A New Design for Interactive Data Visualization in JupyterLab
2024 January 2
Over the past few years, I’ve put a lot of work into WorldWide Telescope’s support for Jupyter. The motivation is pretty simple: a lot of astronomers are already using Jupyter; I expect that that number will only increase over time; and WWT and Jupyter fit really well together from the standpoints of both broad design and the technical details of their implementations. So, it really makes sense to lean into this “form factor” for WWT if you want to get it into the hands of researchers — and I do!
WWT has had a Jupyter integration since 2017, when Tom Robitaille started working on a WWT-based Jupyter widget in the pywwt package. Going all the way back to the first “IPython notebook” release in 2011 — before “Jupyter” even existed — widgets have been the way that you incorporated graphical and/or interactive elements into the notebook environment. But over the past few years, I’ve become less and less satisfied with the user experience (UX) that we can achieve by cramming a sophisticated app like WWT into the widget framework. The work I’ve been doing recently has focused on whether we can do better, and I believe that the answer is a resounding yes. The system that we’ve built for WWT is described in the article A Novel JupyterLab User Experience for Interactive Data Visualization, coauthored with Jon Carifio, Henrik Norman, and David Weigel; it’s currently available on ArXiv.org and will appear in the proceedings of ADASS32.
The key to our new approach is hidden in the title of the article: not just Jupyter, but JupyterLab. The original IPython/Jupyter system was really tightly focused on the “notebook” concept: a single electronic document interleaving code, text, and graphics in a vertical stack. (As far as I know, Mathematica was the first software to introduce this format, but I haven't dug into its origins.) IPython’s contribution was to implement this design for Python, and to do so using web technologies, which had gotten good enough that it made sense to build the UI/UX using a browser-based framework rather than a traditional desktop app system like Qt. The leap from IPython to Jupyter (the latter being first released in 2014) was about expanding this notebook concept from being specific to the Python language, to embracing a whole range of programming languages.
In my view, the jump from “plain Jupyter” to JupyterLab (first released in 2018) is a much bigger change — although, from what I’ve seen the Jupyter community doesn’t seem eager to promote it as such. JupyterLab isn’t just a tool for working with notebooks — it’s a comprehensive environment for interactive scientific computation on the web. It happens to include thorough support for notebooks, but that support lives inside an application framework that is much richer and more sophisticated than the one provided in plain Jupyter. You can get a sense of this from the fact that the @jupyterlab NPM namespace, which is more-or-less a collection of the modules that build up the main JupyterLab frontend, currently consists of 160 different packages. You can write JupyterLab extensions that code against the APIs provided by all of those packages to add new kernels, document types, menu items, and on and on and on. The JupyterLab browser app integrates with its associated web server, which integrates with the various computational kernels that it manages, and this whole framework is extensible and pluggable into the usual menagerie of cloud infrastructure tools.
What does this have to do with WWT? The key thing is that in JupyterLab, you’re not limited to providing interactive functionality only through notebook widgets. You can write JupyterLab extensions that provide interactive features in a whole range of ways, if you want. And — you can probably see where this is going — I don’t think that the notebook widget form factor is a great one for interactive analysis apps like WWT. Specifically:
- At the most basic level, as you work in a notebook, widgets scroll off the screen. This is fine for certain kinds of plots, but for WWT’s interactive image display, it’s much more likely that you're going to want the app to remain in a view for a long time as you execute a whole series of cells.
- Widgets are generally small and inconvenient to resize. Once again, this isn’t always the case, but you’ll often want to make your WWT view really big to take in as much imagery as you can at once.
- The lifetime of a widget is intimately connected with the lifetime of the kernel backing its notebook. For an app as complicated as WWT, there’s basically no realistic way to re-establish its state when the backing kernel restarts, so that you’ll lose your work in frustratingly hard-to-reproduce ways if that happens.
- Jupyter’s built-in infrastructure for “connecting” computational kernels to widgets is a bit limited, especially in the area of bidirectional communications, which is something that WWT would like to use a lot.
These problems are individually solveable-ish in the notebook widget paradigm, as demonstrated by hacks like jupyterlab-sidecar which lets you “pop out” a widget so that it doesn’t scroll out of view. But as I thought about the kind of experience that I wanted WWT-in-Jupyter to feel like, it felt like the widget framework was causing problems everywhere I looked — in terms of both technical implementation, and overall user experience.
Is it realistic to give up the widget paradigm, though? It turns out that in JupyterLab, and with an app like WWT, you can … if you are patient, familiar with a wide range of web technologies, and willing to do some digging.
The vision first clicked for me when I read the JupyterLab Extension Tutorial, which (coincidentally) sets up a demo extension that pulls images from APOD. The tutorial extension adds a new kind of tabbed document to the JupyterLab install and fills it with web content, which is just the kind of foundation that makes sense for a freestanding WWT viewer! A first-draft “native” WWT extension could “just” build on this tutorial and change out the APOD HTML with a WWT iframe.
The bad news is that even this “easy” extension is still a fairly complex piece of software to set up, spanning a range of languages and tools — feel free to do the tutorial yourself and see if you agree! And while I am deeply sympathetic to how hard this is, it felt like the relevant documentation was always missing, incomplete, or even actively misleading. The good news is that once you get past all of the complicated tooling, an extension like this is conceptually pretty simple. You call the right JupyterLab hooks to register what you want and boom, you can add a tab to the environment and insert your own web content.
On top of this foundation we built what we call the WWT “app” for JupyterLab. Along with the article describing it, you can easily try it yourself in the cloud-powered pywwt sample notebooks: click here to launch one.
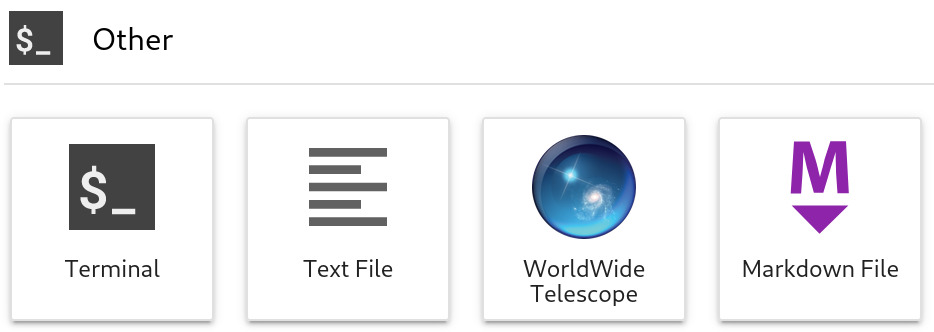
The basic mental model of the “app” paradigm is that we think of WWT as a freestanding, long-lived app that exists inside your JupyterLab environment. You can start it by clicking on a nice big launcher button, without needing to have any notebooks open or kernels running:
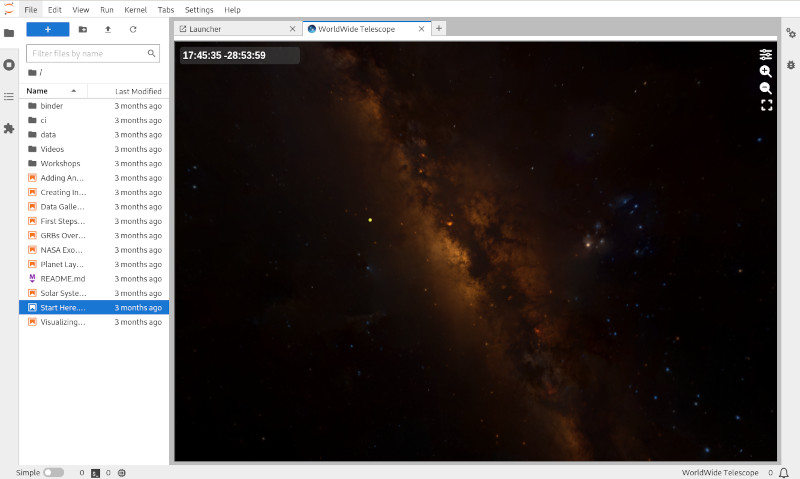
When you click it, you get a big, interactive version of WWT in its own tab:
You can do a lot with this app on its own, without writing a line of Python. This is chiefly because the development framework offered by the JupyterLab extension system lets us build complex UIs using the whole suite of modern web development tools — something that’s a lot more annoying to do in the development framework required for notebook widgets. As it happens, for WWT we build most of this UI in a package called @wwtelescope/research-app, which is separate from @wwtelescope/jupyterlab, which implements the JupyterLab extension wiring. We took this approach since we want the underyling app to be reusable outside of JupyterLab too, but depending on your use case, it might make sense to implement your full UI in your extension.
We then envision that a notebook, or multiple notebooks, can “connect to” the app and issue requests. For Python notebooks, the pywwt package provides this functionality, and it’s a two-liner to set up the connection:
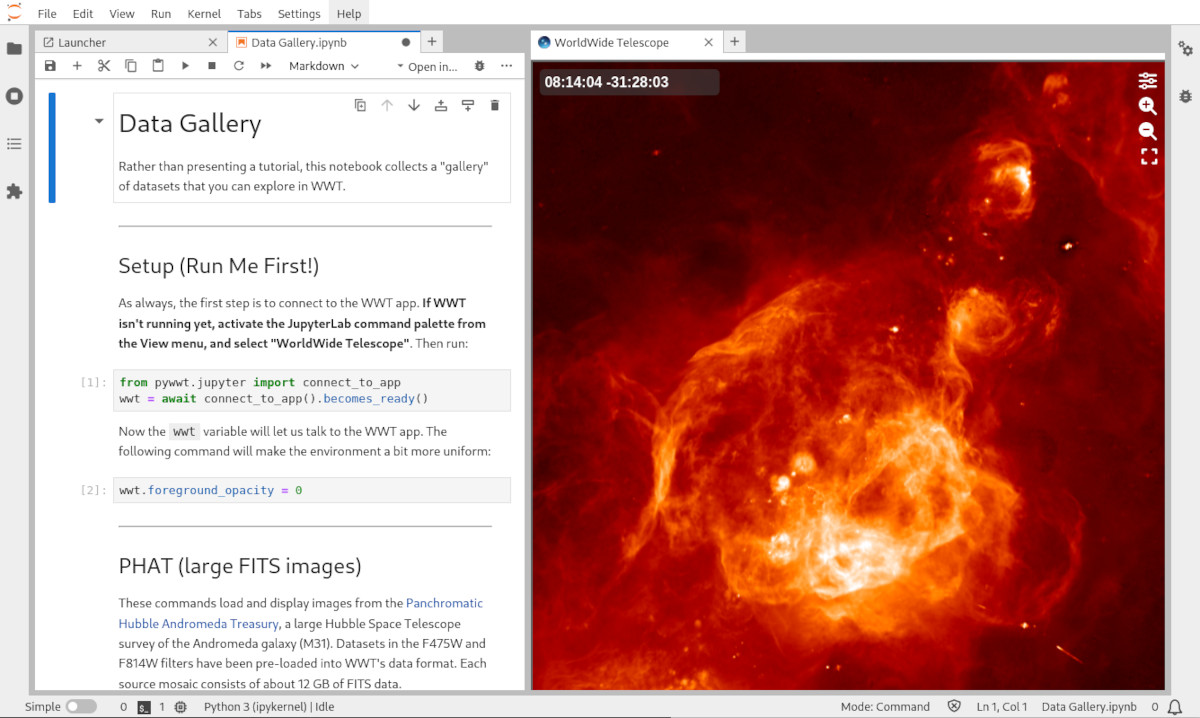
Once the connection is made, the notebook kernel has a wwt variable that can
be used to do things like slew the WWT view, load in images and catalogs, and so
on. Under the hood, these commands are implemented with bidirectional JSON
message passing, using a set of messages codified in a
@wwtelescope/research-app-messages package that are tunneled between kernels
and the frontend using Jupyter’s comms system. Because these messages can
travel both directions, you can do neat things like zoom the WWT view to a
particular location and then populate an Astropy Table with catalog
information about just the sources in the WWT field of view. You have to be
careful when implementing this kind of messaging framework, since multiple
clients can be sending multiple requests around simultaneously and you’re never
guaranteed to receive things completely and in order, but a message-passing
framework is definitely the least-difficult way to provide this kind of
functionality. (Cf. XPA, which has been around in astronomy for decades.)
There are plenty of cases where the notebook widget paradigm is exactly what you want. But I’ll just go ahead and proclaim that for complex, long-lived, interactive software like WWT, this “app paradigm” is so much better. The advantages are strong enough that I have no qualms about asking people to use the more complex JupyterLab environment rather than the simpler “plain Jupyter” — although we’ve built our system so that you can still use WWT as a notebook widget if needed, allowing it to be used outside of the ’Lab.
While the software that we’ve created is specific to WWT, the guiding design principles are completely general. I’d love to see other projects adopt the “JupyterLab app” design when appropriate. I have to assume that others have already built similar systems, but I’m actually not aware of any specific examples. I really hope that our article will help to plant the idea that notebook widgets are just one kind of paradigm for interactive data visualization, one with both strengths and weaknesses. Now that we have JupyterLab, we can explore alternatives.
There’s one more interesting piece to the WWT Jupyter(Lab) support that I’m omitting here, since this post is already pretty long. When you’re doing data visualization in a Jupyter-type environment, you’re probably going to want to visualize data that you computed in one of your notebooks. Due to Jupyter’s multi-tiered architecture, this means that you’d like data to flow from your kernel (which is doing the computing) to your web browser (which is doing the UI), and this is actually surprisingly hard to make happen! Interactive visualization of large datasets presents even more challenges. We ended up needing to create a Jupyter server extension, wwt-kernel-data-relay (KDR), that provides some missing hooks to stream data from kernels to the visualization layer in the browser frontend. The design of the KDR is not at all specific to WWT, and it may be useful to other projects trying to accomplish similar visualization goals in Jupyter. Hopefully I’ll have the chance to write a bit more about it in the future.