Hour-Angle Dependence in ATA Imaging
2011 July 18
I’ve been working on a search for radio transients in repeated ATA observations of Cygnus X-3 and its environs. While looking at various difference images, I realized that there seems to be an hour angle (HA) dependence in ATA imaging. One working theory is that this is due to a phase gradient in the average ATA primary beam (PB), though I haven’t yet investigated this idea deeply.
Figure 1 below demonstrates the effect. Using a dataset of many observations of Cyg X-3, I made four images, each from different HA subsets of the data: one at HA ≅ -5.5, one at HA ≅ -2, one at HA ≅ +2, and one at HA ≅ +5.5. The animation cycles back and forth through the four images. If you follow the source at the very top left of the map, you can see it dance back and forth along a parabolic arc. (It drops below the lower cutoff in the third image.) When it is at its leftmost, the image comes from observations of HA ≅ -5.5; when it is at its rightmost, it comes from HA ≅ +5.5. Obviously, the position of the source should not vary with HA.
The circle denotes the half-power point of the ATA PB at the observing frequency, 3.1 GHz. The other boxes give reference points for other sources; note that the source at phase center, Cyg X-3, does not move appreciably. The plus signs denote approximate fiducial positions of the two distant sources, which are DR 21 and DR 22. There are clearly other aspects of the imaging that are varying; these are likely due to the differing UV coverage of the different observations, and the fact that I have only a few observations at very low HAs, while I have many at moderate- to-high HAs.
Figure 2 shows how the HA variations manifest themselves with regards to the extended structure in the field. The extended structure is brought out by integrating over wider ranges of HA; Figure 2 blinks between data at HA < -3 and HA > +3. The overall effect looks like a translation, though again, the size of the effect increases with distance from phase center. An important point of this figure is that the effect is discernible even well within the first PB null, so it’s not something that only affects a few sources far away from phase center. Additionally, while it’s the case that I’m not using w-projection or faceting, and this might affect the very far-out sources, it shouldn’t be significant for the emission within the half-power point.
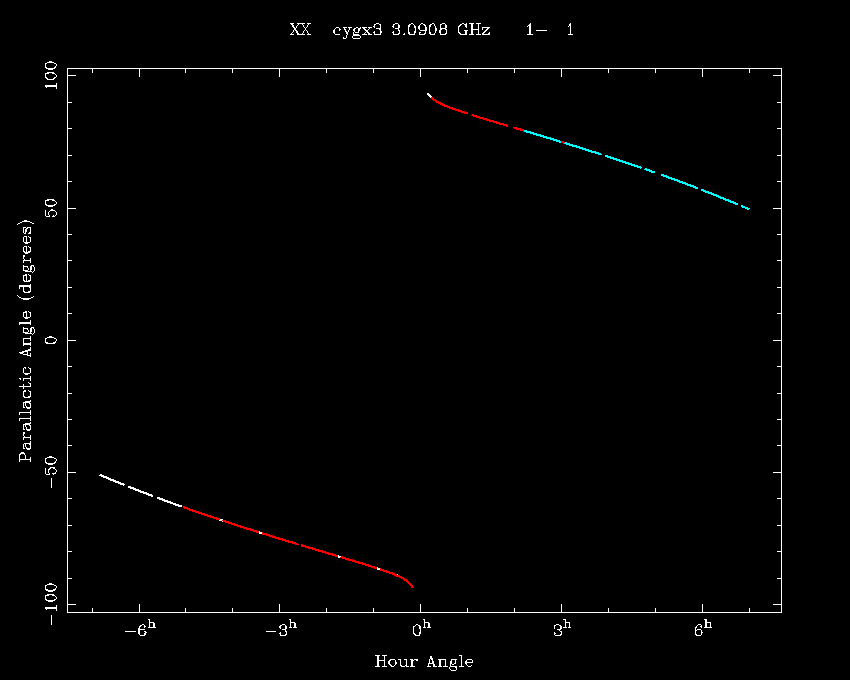
The parallactic angle swings from -50° to +50°, through -180°, as the HA advances from -6 to +6. Figure 3 visualizes this.
When it comes to point sources at more than twice the half-power point, I don’t worry too much about unusual imaging artifacts. But this effect seems to be significant much closer to the phase center as well. You could definitely imagine workarounds: for instance, if I group my data by HA, image the groups, and average the deconvolved images together, I get better results than imaging all of the data at once.
But it would be nice to actually understand and fix the underlying issue. One explanation is that there’s a phase gradient across the mean ATA PB; as the PB rotates on the sky, the position errors on sources away from the phase center vary. You could imagine such a phase gradient arising from some sag in the arm supporting the secondary, since ATA antennas use an offset- Gregorian architecture. This explanation has the advantage of potentially being a nice testcase for using MeqTrees with ATA data. Another possibility that has been suggested to me is that our antenna positions are not quite right and so our UV coordinates get inaccurate at extreme HAs.